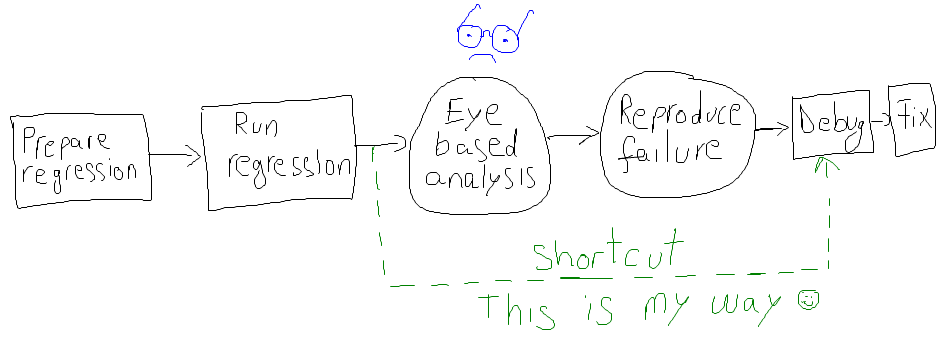
We do pre-silicon verification in multiple iterations, each iteration including at least a regression. Regressions consume a great deal of HW resources (e.g. CPU time) and SW resources (e.g. licenses) and… a lot of human effort. This is what usually happens when we run a regression: we aim to reduce the time spent in regression analysis, especially when we run regressions at a fast pace, for example overnight. We want to see the results in a simple, easy to read report, as soon as possible. We are eager to start debugging issues immediately, instead of aggregating and organizing those tons of information resulting from running a regression. We expect everyone in the team to keep up to date on the regression status with virtually no effort. And in the long run, we want to have a history of regression’s progress.
What I want to show you below is a different way of dealing with these challenges using practical regression automation scripts. The scripts helped me and my teammates approach regressions more effectively and save a lot of time.
A Typical Work Flow

Preparing regression: I write an input file for the regression tool. This file specifies testcases, number of runs, seeds, how many testcases to run in parallel and so on.
Running regression: I launch the regression tool passing it the previously prepared file.
Eyeball analysis:
- At some point, I check whether the regression has ended. Well, sometimes I even forget I started a regression and I only realize by the end of the day that I need to analyze it.
- After I visually detect that the regression has ended, I visually inspect the number of failures and the number of passes.
- Next, I try to understand the different types of failures, either by grouping them manually or with the help of the regression tool.
- At the end of this eyeball analysis, I email to my team to inform them about the regression results. If I’m in a hurry, I may miss some useful data, or I may even provide wrong information to the team. If this happens, try to imagine my colleagues performing the same analysis again… More time consumed…
Reproducing failures:
- I look for a specific failure that I need to investigate
- I find the shortest (by run time) testcase, if possible
- I write down the testcase name and seed
- I open a terminal and setup the project specific environment
- I launch the simulation with wave dumps and increased logging verbosity
An Automated Work Flow
- a pre-session script executed before starting the testcases
- a post-session script executed after all testcases finished
Both scripts extract relevant information and email it using sendmail or mail commands. The relevant information is either provided by dedicated regression tool API, or gathered from output logs using grep, sed, perl, tcl. In any case, it is well worth the effort.
You may download a couple of example scripts and email templates here. They work with Cadence Incisive Enterprise Manager and Mentor Graphics Questa Verification Management.
Start Regression Email Example
The start regression email has an easily recognizable subject and it contains the regression path, system environment information, revision control labels or tags – both of RTL and verification environment, a list of locally modified files, and in general any information that could be relevant to reproduce a test run.
From: tester@asic.com
To: team@asic.com
Subject: [START REGRESSION][SYSTEM][BLOCK] regression_id_1_20120315

Hi team!

The following regression started:
/path/to/the/regression/folder

The following labels are used:
RTL_LABEL_01
VE_LABEL_01

The following files are checked-out:
/path/to/checkedout/file1
/path/to/checkedout/file2
/path/to/checkedout/file3
End Regression Email Example
The end regression email has an easily recognizable subject. In addition to the information found in the start regression email, it contains the total number of runs, the number of passed and failed runs and the list of failure groups – including the three shortest runs for each group identified by testname and seed.
From: tester@asic.com
To: team@asic.com
Subject: [END REGRESSION][SYSTEM][BLOCK] regression_id_1_20120315

Hi team!

Here you may find the result of the regression regression_id_1_20120315:
/path/to/the/regression/folder

Total tests run: 200
PASSED:180
FAILED: 20

Unfinished tests [1/200]:
test_scenario_1 seed=12112121 (cpu time=4h:0m:0s)

FAILING GROUP 1 [12/200]: PORT_VALUE_MISMATCH
test_port_values
seed=12112121 (cpu time=0h:3m:5s)

FAILING GROUP 2 [7/200]: REGISTER_VALUE_MISMATCH
test_registers
seed=12112121 (cpu time=0h:40m:22s)

The following labels have been used:
RTL_LABEL_01
VE_LABEL_01
GLOBAL_LABEL_01

The following files were checked out at the moment the regression started:
/path/to/checkedout/file1
/path/to/checkedout/file2


Enjoy!

5 Responses
This is great article!!!
Hi
it was indeed a great article .
It would be a great help , if you would give me following iinputs from your side
1. Where the below mentioned scripts should be included /called ?
analyzed_failed_rerun
vm_analyzer
pre_start_regression
Hi, Rajivdesh.
If you look at the analyzed_failed_rerun.sh you will see it contains a reference (it makes use) of vm_analyzer.e
pre_start_regression.sh is started before regression starts and analyzed_failed_and_rerun.sh is started after regression finished.
These are hooks inside your regression manager tool.
For example in vManager there are these vsif attributes called: pre_session_script and post_session_script.
Thank you Aurelian Ionel Munteanu
The above scripts work with Emanager in cadence which is an outdated version .
It would really help if the scripts are updated with latest VManger
Hi, Rajivdesh.
I don’t plan to update those soon.
The scripts are Open Source: you can modify them and contribute the solution for everyone in the community to use.
Check it out on our GitHub-link
Cheers,
Aurelian